Tired of missed alerts buried in noisy channels like SMS, Slack, and email? OnPage delivers high-priority notifications for infrastructure failures, database issues, and on-call incidents—so your team always knows when it’s go time.
-
Real-Time Alerting & OnCall for Infrastructure, Database, and Application Failures

.png "G2 - High Performer - Summer 2025")
.png "G2 - Fastest Implementation - Summer 2025")
.png "G2 - Best ROI - Summer 2025")


.png "G2 - Momentum Leader - Summer 2025")
.png "G2 - Users Love Us")
Infrastructure Alerting
Receive immediate incident alerts when your servers, network equipment, or cloud infrastructure experience failures or performance issues.
- Alert on server downtime, CPU spikes, or disk failures
- Integrate with tools like Nagios, Zabbix, Datadog, and AWS CloudWatch
- Route alerts based on on-call schedules or escalation policies
Example:
Your EC2 instance goes down in the middle of the night. OnPage receives the CloudWatch alert, escalates it to the right SRE on-call, and confirms alert delivery—all within seconds.

Database Alerting & Notifications
Ensure you’re always informed of critical database performance issues, connection failures, or replication lag.
- Monitor databases like MYSQL, PostgreSQL, MongoDB, or Oracle.
- Receive alerts from databse montioring tools like Percona, Prometheus, or SolarWinds.
- Automated alert delivery for query failures, slow performance, or unauthorized access
Example:
A spike in query latency in your PostgreSQL database triggers an alert in Percona. OnPage’s Incident Alert Management immediately notifies the DB admin on-call via a high-priority mobile alert, cutting down triage time dramatically.

Cloud & Hybrid Environment Alerts
Monitor your multi-cloud and hybrid systems with real-time alerting that cuts through the noise.
- Get alerted on Azure, AWS, and GCP resource issues
- Handle Kubernetes pod crashes or container issues fast
- Connect with tools like Prometheus, Grafana, or Elastic Stack
Example:
Your Kubernetes pod fails health checks at night. Prometheus triggers an alert, OnPage routes it to your on-call DevOps engineer, who gets a persistent alert that overrides Do Not Disturb that wakes them up to resolve the issue promptly.

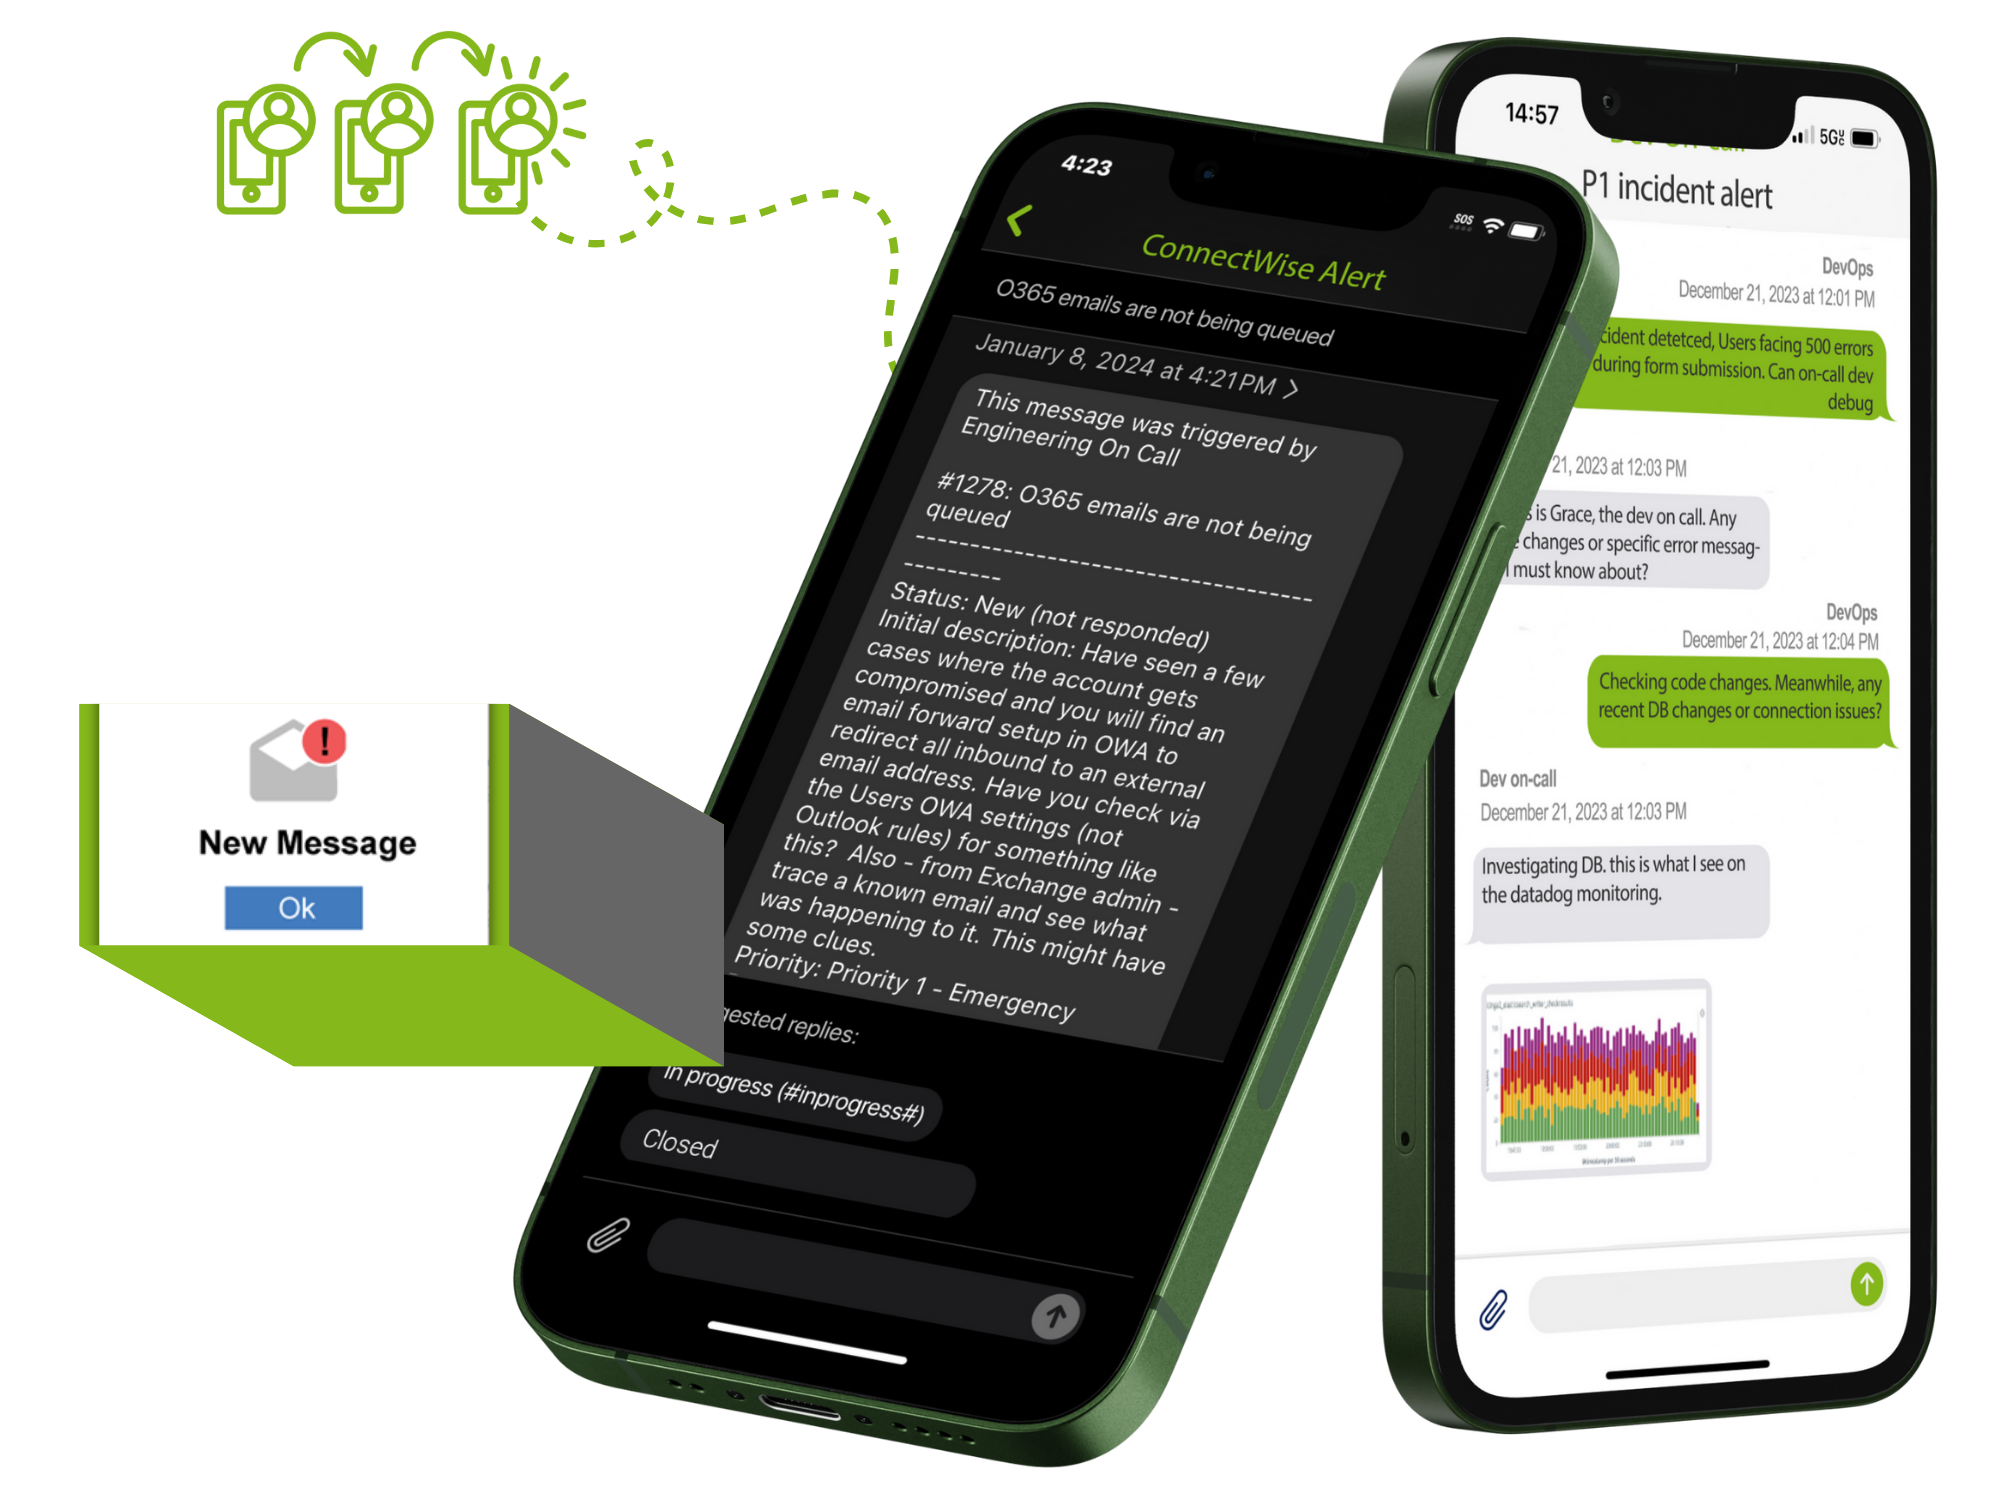
Application Performance Monitoring (APM) Alerts
Catch app failures before they impact users by staying ahead of downtime and anomalies.
- Integrate with APM tools like New Relic, AppDynamics, or Datadog
- Alert on 500 errors, latency spikes, or service outages
- Trigger workflows for resolution across teams
Example:
New Relic detects a sudden rise in 500 errors for a critical login service. OnPage delivers a real-time alert to the on-call full-stack dev, who responds before users report issues.

DevOps & CI/CD Pipeline Notifications
Stay informed on deployment failures, test breaks, or build delays—so issues never go unnoticed.
- Receive alerts from Jenkins, CircleCI, GitHub Actions, and GitLab CI
- Alert on pipeline failures, rollback triggers, or failed unit tests
- Escalate to developers when automation fails
Example:
Your nightly deployment fails in GitLab CI due to a broken migration script. OnPage alerts the dev team lead immediately so they can investigate before the next deploy window.

Security & Compliance Alerting
Act on security events in real time to minimize risk and maintain compliance.
- Get alerts from SIEM tools like Splunk, Sumo Logic, or QRadar
- Monitor for failed login attempts, unauthorized access, policy breach or firewall breaches
- Ensure incident response is always covered, even after hours
Example:
Your firewall flags repeated failed login attempts. Splunk sends an alert to OnPage, which notifies the security analyst on-call with a persistent, traceable alert.

Real-Time System Failure Notifications
When systems fail—whether it’s a server crash, broken database replication, or a failed deployment—every second counts. OnPage routes these critical alerts directly to the right responder, ensuring no system failure goes unnoticed.
- Immediate alerting for system outages, crashes, or degraded performance
- Integrate with system monitoring tools like Zabbix, Nagios, Datadog, and Prometheus
- Auto-escalate alerts for unacknowledged failures
Example:
A core service in your backend stack crashes, causing downstream API failures. Datadog sends an alert to OnPage, which notifies your SRE on-call with a persistent high-priority tone—escalating if not acknowledged.

Security & Compliance🔒
|
|
Start Your Journey to Critical Alerting in Just Minutes


Download Our App
Set up a 7-day free trial of our phone app in just a few minutes.